The size of a population for any species is not a static parameter. It keeps changing with time, depending on various factors including food availability, predation pressure and adverse weather. In fact, it is these changes in population density that give us some idea of what is happening to the population – whether it is flourishing or declining. Whatever might be the ultimate reasons, the density of a population in a given habitat during a given period, fluctuates due to changes in four basic processes, two of which (natality and immigration) contribute to an increase in population density and two (mortality and emigration) to a decrease.
(i) Natality refers to the number of births during a given period in the population that are added to the initial density.
(ii) Mortality is the number of deaths in the population during a given period.
(iii) Immigration is the number of individuals of the same species that have come into the habitat from elsewhere during the time period under consideration.
(iv) Emigration is the number of individuals of the population who left the habitat and gone elsewhere during the time period under consideration.
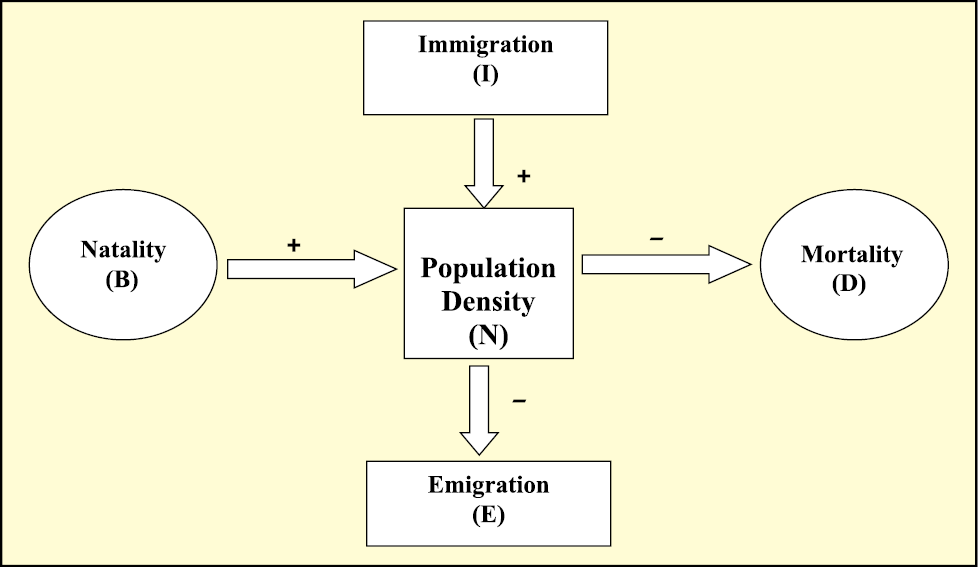
Figure 13.5
So, if N is the population density at time t, then its density at time t +1 is
Nt+1 = Nt + [(B + I) – (D + E)]
You can see from the above equation (Fig. 13.5) that population density will increase if the number of births plus the number of immigrants (B + I) is more than the number of deaths plus the number of emigrants (D + E). Under normal conditions, births and deaths are the most important factors influencing population density, the other two factors assuming importance only under special conditions. For instance, if a new habitat is just being colonised, immigration may contribute more significantly to population growth than birth rates.
Growth Models : Does the growth of a population with time show any specific and predictable pattern? We have been concerned about unbridled human population growth and problems created by it in our country and it is therefore natural for us to be curious if different animal populations in nature behave the same way or show some restraints on growth. Perhaps we can learn a lesson or two from nature on how to control population growth.
a when responses are not limiting the growth, plot is exponential,
b when responses are limiting the growth, plot is logistic,
K is carrying capacity
(i) Exponential growth: Resource (food and space) availability is obviously essential for the unimpeded growth of a population. Ideally, when resources in the habitat are unlimited, each species has the ability to realise fully its innate potential to grow in number, as Darwin observed while developing his theory of natural selection. Then the population grows in an exponential or geometric fashion. If in a population of size N, the birth rates (not total number but per capita births) are represented as b and death rates (again, per capita death rates) as d, then the increase or decrease in N during a unit time period t (dN/dt) will be
dN/dt = (b – d) × N
Let (b–d) = r, then
dN/dt = rN
The r in this equation is called the ‘intrinsic rate of natural increase’ and is a very important parameter chosen for assessing impacts of any biotic or abiotic factor on population growth.
To give you some idea about the magnitude of r values, for the Norway rat the r is 0.015, and for the flour beetle it is 0.12. In 1981, the r value for human population in India was 0.0205. Find out what the current r value is. For calculating it, you need to know the birth rates and death rates.
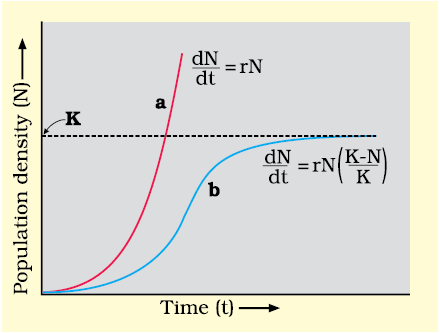
Figure 13.6 Population growth curve
a when responses are not
limiting the growth, plot is
exponential,
b when responses are limiting
the growth, plot is logistic,
K is carrying capacity
The above equation describes the exponential or geometric growth pattern of a population (Figure 13.6) and results in a J-shaped curve when we plot N in relation to time. If you are familiar with basic calculus, you can derive the integral form of the exponential growth equation as
Nt = N0 ert
where
Nt = Population density after time t
N0 = Population density at time zero
r = intrinsic rate of natural increase
e = the base of natural logarithms (2.71828)
Any species growing exponentially under unlimited resource conditions can reach enormous population densities in a short time. Darwin showed how even a slow growing animal like elephant could reach enormous numbers in the absence of checks. The following is an anecdote popularly narrated to demonstrate dramatically how fast a huge population could build up when growing exponentially.
The king and the minister sat for a chess game. The king, confident of winning the game, was ready to accept any bet proposed by the minister. The minister humbly said that if he won, he wanted only some wheat grains, the quantity of which is to be calculated by placing on the chess board one grain in Square 1, then two in Square 2, then four in Square 3, and eight in Square 4, and so on, doubling each time the previous quantity of wheat on the next square until all the 64 squares were filled. The king accepted the seemingly silly bet and started the game, but unluckily for him, the minister won. The king felt that fulfilling the minister’s bet was so easy. He started with a single grain on the first square and proceeded to fill the other squares following minister’s suggested procedure, but by the time he covered half the chess board, the king realised to his dismay that all the wheat produced in his entire kingdom pooled together would still be inadequate to cover all the 64 squares. Now think of a tiny Paramecium starting with just one individual and through binary fission, doubling in numbers every day, and imagine what a mind-boggling population size it would reach in 64 days. (provided food and space remain unlimited)
(ii) Logistic growth: No population of any species in nature has at its disposal unlimited resources to permit exponential growth. This leads to competition between individuals for limited resources. Eventually, the ‘fittest’ individual will survive and reproduce. The governments of many countries have also realised this fact and introduced various restraints with a view to limit human population growth. In nature, a given habitat has enough resources to support a maximum possible number, beyond which no further growth is possible. Let us call this limit as nature’s carrying capacity (K) for that species in that habitat.
A population growing in a habitat with limited resources show initially a lag phase, followed by phases of acceleration and deceleration and finally an asymptote, when the population density reaches the carrying capacity. A plot of N in relation to time (t) results in a sigmoid curve. This type of population growth is called Verhulst-Pearl Logistic Growth (Figure 13.6) and is described by the following equation:
dN/dt = rN
Where N = Population density at time t
r = Intrinsic rate of natural increase
K = Carrying capacity
Since resources for growth for most animal populations are finite and become limiting sooner or later, the logistic growth model is considered a more realistic one.
Gather from Government Census data the population figures for India for the last 100 years, plot them and check which growth pattern is evident.
© 2026 GoodEd Technologies Pvt. Ltd.

