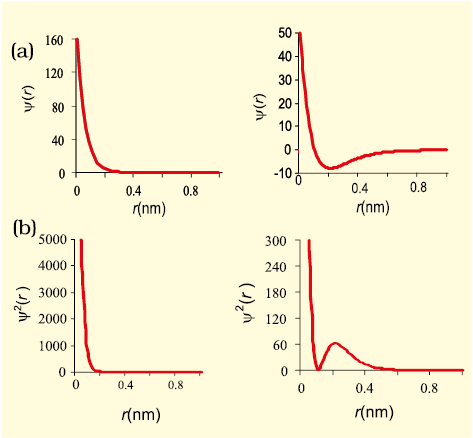
The orbital wave function or ψ for an electron in an atom has no physical meaning. It is simply a mathematical function of the coordinates of the electron. However, for different orbitals the plots of corresponding wave functions as a function of r (the distance from the nucleus) are different. Fig. 2.12(a), gives such plots for 1s (n = 1, l = 0) and 2s (n = 2, l = 0) orbitals.

Fig. 2.12 The plots of (a) the orbital wave function ψ(r ); (b) the variation of probability density ψ2(r) as a function of distance r of the electron from the nucleus for 1s and 2s orbitals.
According to the German physicist, Max Born, the square of the wave function (i.e.,ψ 2) at a point gives the probability density of the electron at that point. The variation of ψ 2 as a function of r for 1s and 2s orbitals is given in Fig. 2.12(b). Here again, you may note that the curves for 1s and 2s orbitals are different.
It may be noted that for 1s orbital the probability density is maximum at the nucleus and it decreases sharply as we move away from it. On the other hand, for 2s orbital the probability density first decreases sharply to zero and again starts increasing. After reaching a small maxima it decreases again and approaches zero as the value of r increases further. The region where this probability density function reduces to zero is called nodal surfaces or simply nodes. In general, it has been found that ns-orbital has (n – 1) nodes, that is, number of nodes increases with increase of principal quantum number n. In other words, number of nodes for 2s orbital is one, two for 3s and so on.
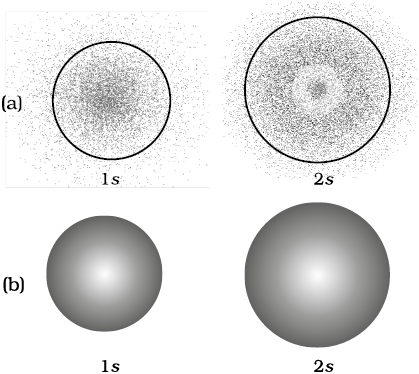
These probability density variation can be visualised in terms of charge cloud diagrams [Fig. 2.13(a)]. In these diagrams, the density of the dots in a region represents electron probability density in that region.
Boundary surface diagrams of constant probability density for different orbitals give a fairly good representation of the shapes of the orbitals. In this representation, a boundary surface or contour surface is drawn in space for an orbital on which the value of probability density |ψ|2 is constant. In principle many such boundary surfaces may be possible. However, for a given orbital, only that boundary surface diagram of constant probability density* is taken to be good representation of the shape of the orbital which encloses a region or volume in which the probability of finding the electron is very high, say, 90%. The boundary surface diagram for 1s and 2s orbitals are given in Fig. 2.13(b). One may ask a question : Why do we not draw a boundary surface diagram, which bounds a region in which the probability of finding the electron is, 100 %? The answer to this question is that the probability density |ψ|2 has always some value, howsoever small it may be, at any finite distance from the nucleus. It is therefore, not possible to draw a boundary surface diagram of a rigid size in which the probability of finding the electron is 100%. Boundary surface diagram for a s orbital is actually a sphere centred on the nucleus. In two dimensions, this sphere looks like a circle. It encloses a region in which probability of finding the electron is about 90%.

Fig. 2.13 (a) Probability density plots of 1s and 2s atomic orbitals. The density of the dots represents the probability density of finding the electron in that region. (b) Boundary surface diagram for 1s and 2s orbitals.
Thus, we see that 1s and 2s orbitals are spherical in shape. In reality all the s-orbitals are spherically symmetric, that is, the probability of finding the electron at a given distance is equal in all the directions. It is also observed that the size of the s orbital increases with increase in n, that is, 4s > 3s > 2s > 1s and the electron is located further away from the nucleus as the principal quantum number increases.
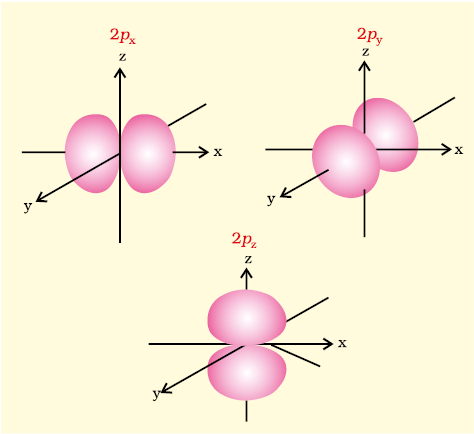
Boundary surface diagrams for three 2p orbitals (l = 1) are shown in Fig. 2.14. In these diagrams, the nucleus is at the origin. Here, unlike s-orbitals, the boundary surface diagrams are not spherical. Instead each p orbital consists of two sections called lobes that are on either side of the plane that passes through the nucleus. The probability density function is zero on the plane where the two lobes touch each other. The size, shape and energy of the three orbitals are identical. They differ however, in the way the lobes are oriented. Since the lobes may be considered to lie along the x, y or z axis, they are given the designations 2px, 2py, and 2pz. It should be understood, however, that there is no simple relation between the values of ml (–1, 0 and +1) and the x, y and z directions. For our purpose, it is sufficient to remember that, because there are three possible values of ml, there are, therefore, three p orbitals whose axes are mutually perpendicular. Like s orbitals, p orbitals increase in size and energy with increase in the principal quantum number and hence the order of the energy and size of various p orbitals is 4p > 3p > 2p. Further, like s orbitals, the probability density functions for p-orbital also pass through value zero, besides at zero and infinite distance, as the distance from the nucleus increases. The number of nodes are given by the n –2, that is number of radial node is 1 for 3p orbital, two for 4p orbital and so on.

Fig. 2.14 Boundary surface diagrams of the three 2p orbitals.
* If probability density |ψ|2 is constant on a given surface, |ψ| is also constant over the surface. The boundary surface for |ψ|2 and |ψ| are identical.

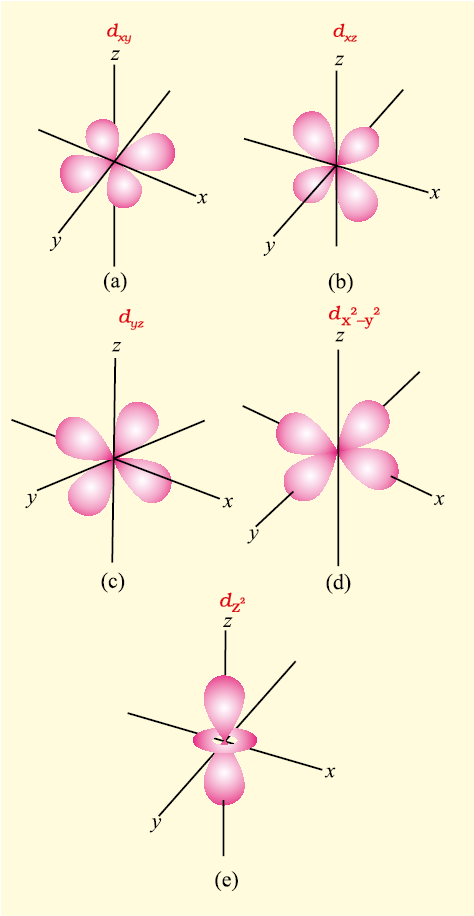
Fig. 2.15 Boundary surface diagrams of the five 3d orbitals.
For l = 2, the orbital is known as d-orbital and the minimum value of principal quantum number (n) has to be 3. as the value of l cannot be greater than n–1. There are five ml values (–2, –1, 0, +1 and +2) for l = 2 and thus there are five d orbitals. The boundary surface diagram of d orbitals are shown in Fig. 2.15.
The five d-orbitals are designated as dxy, dyz, dxz, dx2–y2 and dz2. The shapes of the first four d-orbitals are similar to each other, where as that of the fifth one, dz2, is different from others, but all five 3d orbitals are equivalent in energy. The d orbitals for which n is greater than 3 (4d, 5d...) also have shapes similar to 3d orbital, but differ in energy and size.
Besides the radial nodes (i.e., probability density function is zero), the probability density functions for the np and nd orbitals are zero at the plane (s), passing through the nucleus (origin). For example, in case of pz orbital, xy-plane is a nodal plane, in case of dxy orbital, there are two nodal planes passing through the origin and bisecting the xy plane containing z-axis. These are called angular nodes and number of angular nodes are given by ‘l’, i.e., one angular node for p orbitals, two angular nodes for ‘d’ orbitals and so on. The total number of nodes are given by (n–1), i.e., sum of l angular nodes and (n – l – 1) radial nodes.