- 1(current)
 Q. No.
If \(E\) and \(V\) are electric field and electric potential respectively due to a point charge, then which of the following graph best represents their variation?
| 1. |  |
2. |  |
| 3. |  |
4. |  |


Subtopic: Relation between Field & Potential |
To view explanation, please take trial in the course.
NEET 2025 - Target Batch
Hints
To view explanation, please take trial in the course.
NEET 2025 - Target Batch

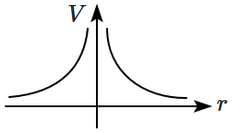
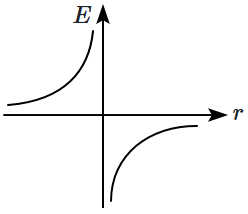
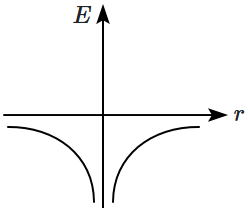
The electric field (\(E\)) and potential (\(V\)) due to the field are related as \(E=-\dfrac{dV}{dr}\). For the \(V\) vs \(r\) graph shown, identify the correct \(E\) vs \(r\) graph:
| 1. | 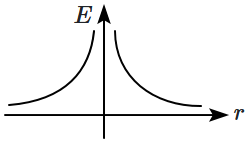 |
2. |  |
| 3. | 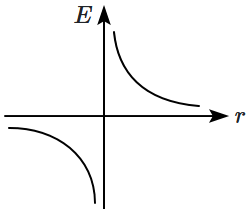 |
4. |  |
Subtopic: Relation between Field & Potential |
From NCERT
To view explanation, please take trial in the course.
NEET 2025 - Target Batch
Hints
To view explanation, please take trial in the course.
NEET 2025 - Target Batch
The variation of potential with distance \(R\) from a fixed point is shown in the figure. The electric field at \(R=5~\text{m}\) is:
(Given, the potential, \(V\) in volts and distance, \(R\) in meters)

1. \(2.5~\text{Vm}^{-1}\)
2. \(-2.5~\text{Vm}^{-1}\)
3. \(\dfrac{2}{5}~\text{Vm}^{-1}\)
4. \(-\dfrac{2}{5}~\text{Vm}^{-1}\)
(Given, the potential, \(V\) in volts and distance, \(R\) in meters)
1. \(2.5~\text{Vm}^{-1}\)
2. \(-2.5~\text{Vm}^{-1}\)
3. \(\dfrac{2}{5}~\text{Vm}^{-1}\)
4. \(-\dfrac{2}{5}~\text{Vm}^{-1}\)
Subtopic: Relation between Field & Potential |
From NCERT
To view explanation, please take trial in the course.
NEET 2025 - Target Batch
Hints
To view explanation, please take trial in the course.
NEET 2025 - Target Batch


- 1(current)
Q. No.© 2024 GoodEd Technologies Pvt. Ltd.