
 Q. No.
A ball is dropped vertically from a height d above the ground. It hits the ground and bounces up vertically to a height d/2. Neglecting subsequent motion and air resistance, its velocity v varies with the height h above the ground is
1.

2.

3.

4.


The graph of displacement v/s time is
Its corresponding velocity-time graph will be
1. 
3. 


A train moves from one station to another in 2 hours time. Its speed-time graph during this motion is shown in the figure. The maximum acceleration during the journey is
1. \(140\) km h-2
2. \(160\) km h-2
3. \(100\) km h-2
4. \(120\) km h-2


A ball is thrown vertically upwards. Which of the following plots represents the speed-time graph of the ball during its height if the air resistance is not ignored?
| 1. | 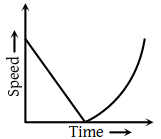 |
| 2. |  |
| 3. |  |
| 4. |  |


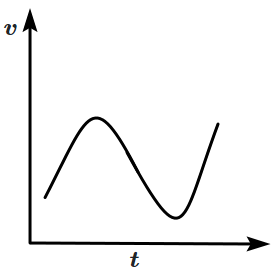
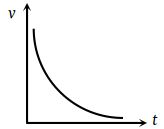
Which of the following velocity-time graphs shows a realistic situation for a body in motion?
| 1. |  |
2. |  |
| 3. |  |
4. |  |


Acceleration-time graph of a body is shown.
The corresponding velocity-time graph of the same body is:

| 1. |  |
2. |  |
| 3. |  |
4. |  |
The acceleration-time graph of a body is shown below.

The most probable velocity-time graph of the body is
| 1. |  |
| 2. |  |
| 3. |  |
| 4. |  |


The v – t plot of a moving object is shown in the figure. The average velocity of the object during the first 10 seconds is

1. 0
2. 2.5 ms–1
3. 5 ms–1
4. 2 ms–1
© 2025 GoodEd Technologies Pvt. Ltd.