
 Q. No.
In a photocell bichromatic light of wavelength 2475 Å and 6000 Å are incident on cathode whose work function is 4.8 eV. If a uniform magnetic field of Tesla exists parallel to the plate, the radius of the path described by the photoelectron will be (mass of electron = kg)
(1) 1 cm
(2) 5 cm
(3) 10 cm
(4) 25 cm


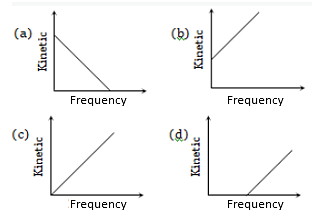
According to Einstein's photoelectric equation, the graph between the kinetic energy of photoelectrons ejected and the frequency of incident radiation is
For the photoelectric effect, the maximum kinetic energy of the emitted photoelectrons is plotted against the frequency v of the incident photons as shown in the figure. The slope of the curve gives

(a) Charge of the electron
(b) Work function of the metal
(c) Planck's constant
(d) Ratio of the Planck’s constant to electronic charge


The stopping potential \(V\) for photoelectric emission from a metal surface is plotted along the \(Y\text-\)axis and the frequency \(\nu\) of incident light along the \(X\text-\)axis. A straight line is obtained as shown in the figure. Planck's constant is given by:

| 1. | the slope of the line. |
| 2. | the product of slope on the line and charge on the electron. |
| 3. | the product of intercept along the \(Y\text-\)axis and mass of the electron. |
| 4. | the product of the slope and mass of the electron. |
In an experiment on the photoelectric effect, the frequency \(f\) of the incident light is plotted against the stopping potential \(V_0.\) The work function of the photoelectric surface is given by:
(\(e\) is an electronic charge)

| 1. | \(OB\times e\) in eV |
| 2. | \(OB\) in volt |
| 3. | \(OA\) in eV |
| 4. | The slope of the line \(AB\) |
The stopping potential as a function of the frequency of the incident radiation is plotted for two different photoelectric surfaces \(A\) and \(B\). The graphs demonstrate that \(A\)'s work function is:

| 1. | Greater than that of \(B\). | 2. | Smaller than that of \(B\). |
| 3. | Equal to that of \(B\). | 4. | No inference can be drawn about their work functions from the given graphs. |


| 1. |  |
2. |  |
| 3. |  |
4. |  |
| 1. |  |
2. |  |
| 3. |  |
4. |  |
| 1. |  |
2. |  |
| 3. |  |
4. |  |


The value of stopping potential in the following diagram is given by:

| 1. | \(-4\) V | 2. | \(-3\) V |
| 3. | \(-2\) V | 4. | \(-1\) V |
© 2026 GoodEd Technologies Pvt. Ltd.