
 Q. No.
When a ball is thrown up vertically with velocity V0, it reaches a maximum height of 'h'. If one wishes to triple the maximum height then the ball should be thrown with velocity
1.
2. 3 V0
3. 9 V0
4. 3/2 V0
जब एक गेंद को V0 वेग के साथ लंबवत फेंका जाता है, यह अधिकतम ऊंचाई 'h' तक पहुंचता है। यदि कोई अधिकतम ऊंचाई को तिगुना करना चाहता है तो उसे गेंद को कितने वेग से फेंकना चाहिए:
1.
2. 3 V0
3. 9 V0
4. 3/2 V0


A car, starting from rest, accelerates at the rate f through a distance S, then continues at constant speed for time t and then decelerates at the rate to come to rest. If the total distance traversed is 15 S, then
(1)
(2)
(3)
(4)
एक कार, विरामावस्था से शुरू होकर, S दूरी के मध्य f दर से त्वरित होती है, फिर t समय के लिए नियत गति से गतिमान रहती है और फिर विरामावस्था में आने के लिए दर से मंदन होता है। यदि तय की गई कुल दूरी 15 S है, तब
(1)
(2)
(3)
(4)
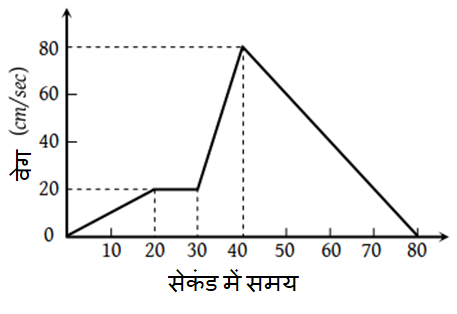
The v – t graph of a moving object is given in figure. The maximum acceleration is

1.
2.
3.
4.
किसी गतिशील वस्तु का v – t ग्राफ चित्र में दर्शाया गया है। अधिकतम त्वरण कितना है:
1.
2.
3.
4.


From the top of a tower, a particle is thrown vertically downwards with a velocity of 10 m/s. The ratio of the distances, covered by it in the 3rd and 2nd seconds of the motion is (Take )
1. 5 : 7
2. 7 : 5
3. 3 : 6
4. 6 : 3
टॉवर के शीर्ष से, एक कण 10 m/s के वेग के साथ लंबवत नीचे की ओर फेंका जाता है। गति के तीसरे और दूसरे सेकंड में इसके द्वारा तय की गई दूरियों का अनुपात कितना है (माना )
1. 5 : 7
2. 7 : 5
3. 3 : 6
4. 6 : 3
The relation describes the displacement of a particle in one direction where x is in metres and t in sec. The displacement, when velocity is zero, is
1. 24 metres
2. 12 metres
3. 5 metres
4. Zero
सम्बन्ध एक कण के एक दिशा में विस्थापन को दर्शाता है जहाँ x मीटर और t सेकेंड में है। विस्थापन, जब वेग शून्य है, है-
मीटर
मीटर
मीटर
4. शून्य
In the following graph, distance travelled by the body in metres is

(1) 200
(2) 250
(3) 300
(4) 400
निम्नलिखित ग्राफ में, पिंड द्वारा तय की गई दूरी मीटर में कितनी है:
(1) 200
(2) 250
(3) 300
(4) 400


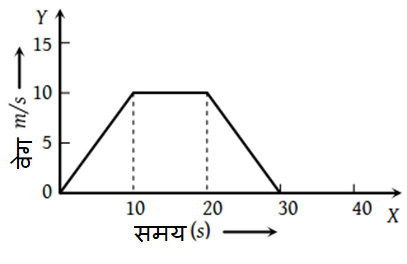
The v – t plot of a moving object is shown in the figure. The average velocity of the object during the first 10 seconds is

(1) 0
(2) 2.5 ms–1
(3) 5 ms–1
(4) 2 ms–1
गतिमान वस्तु का v – t आलेख चित्र में दर्शाया गया है। पहले 10 सेकंड के दौरान वस्तु का औसत वेग कितना है:

(1) 0
(2) 2.5 ms–1
(3) 5 ms–1
(4) 2 ms–1
A motor car moving with a uniform speed of 20 m/sec comes to stop on the application of brakes after travelling a distance of 10 m Its acceleration is
(1) 20 m/sec2
(2) –20 m/sec2
(3) –40 m/sec2
(4) +2 m/sec2
20 मीटर / सेकंड की एकसमान गति के साथ चलने वाली मोटर कार, ब्रेक लगाने पर 10 मीटर की दूरी तय करने के बाद रुक जाती है, इसका त्वरण कितना है?
(1) 20 m/sec2
(2) –20 m/sec2
(3) –40 m/sec2
(4) +2 m/sec2
The position x of a particle varies with time t as . The acceleration of the particle will be zero at time t equal to
(1)
(2)
(3)
(4) Zero
एक कण की स्थिति x, t समय के साथ के रूप में परिवर्तित होती है। कण का त्वरण t समय पर शून्य होगा, t किसके बराबर होगा:
(1)
(2)
(3)
(४) शून्य


Acceleration-time graph of a body is shown. The corresponding velocity-time graph of the same body is

| (1) |  |
| (2) |  |
| (3) |  |
| (4) |  |
एक पिंड का त्वरण-समय ग्राफ प्रदर्शित गया है। उसी पिंड का संबंधित वेग-समय ग्राफ क्या है:
| (1) | |
| (2) | |
| (3) | |
| (4) | |
© 2026 GoodEd Technologies Pvt. Ltd.