
 Q. No.
One mole of an ideal gas requires 207 J heat to raise the temperature by 10 K when heated at constant pressure. If the same gas is heated at constant volume to raise the temperature by the same 10 K, the heat required is
1. 198.7 J
2. 29 J
3. 215.3 J
4. 124 J
(Given the gas constant )
एक आदर्श गैस के एक मोल को जब नियत दाब पर गर्म किया जाता है तो ताप को 10 K तक बढ़ाने के लिए 207 J ऊष्मा की आवश्यकता होती है। यदि समान गैस का तापमान 10 K तक बढ़ाने के लिए नियत आयतन पर गर्म किया जाता है, तब आवश्यक ऊष्मा है:
1. 198.7 J
2. 29 J
3. 215.3 J
4. 124 J
(गैस नियतांक दिया गया है)


The expansion of an ideal gas of mass m at a constant pressure P is given by the straight line D. Then the expansion of the same ideal gas of mass 2m at a pressure P/ 2 is given by the straight line , where number on graphs indicate slope , is-

1. E
2. C
3. B
4. A
द्रव्यमान m की एक आदर्श गैस का एक नियत दाब P पर प्रसार सीधी रेखा D द्वारा दिया जाता है। तब P/2 दाब पर 2m द्रव्यमान की समान आदर्श गैस का प्रसार किस सरल रेखा द्वारा दिया जाता है, जहाँ ग्राफ पर संख्याएं ढलान दर्शाती हैं?
1. E
2. C
3. B
4. A
The expansion of unit mass of a perfect gas at constant pressure is shown in the diagram. Here

1. a = volume, b = temperature
2. a = volume, b = temperature
3. a = temperature, b = volume
4. a = temperature, b = volume
नियत दाब पर एक आदर्श गैस के इकाई द्रव्यमान तक के प्रसार को ग्राफ में दर्शाया गया है। यहाँ
1. a = आयतन, b = तापमान
2. a = आयतन, b = तापमान
3. a = तापमान, b = आयतन
4. a = तापमान, b = आयतन


A pressure P - absolute temperature T diagram was obtained when a given mass of gas was heated. During the heating process from the state 1 to state 2 the volume

1. Remained constant
2. Decreased
3. Increased
4. Changed erratically
एक दाब P - परम ताप T आरेख तब प्राप्त किया गया था जब गैस का दिया गया द्रव्यमान गर्म किया गया था। अवस्था 1 से अवस्था 2 तक गर्म करने की प्रक्रिया के दौरान आयतन:
1. नियत बना रहता है
2. घटता है
3. बढ़ता है
4. अनिश्चित रूप से परिवर्तित होता है
Two gases of equal mass are in thermal equilibrium. If and and are their respective pressures and volumes, then which relation is true
1.
2.
3.
4.
समान द्रव्यमान की दो गैसें तापीय साम्यावस्था में हैं। यदि और और उनके संबंधित दाब और आयतन हैं, तो कौन सा संबंध सही है?
1.
2.
3.
4.
The figure shows the volume V versus temperature T graphs for a certain mass of a perfect gas at two constant pressures of and . What interference can you draw from the graphs

1.
2.
3.
4. No interference can be drawn due to insufficient information
आकृति दो नियत दाबों और पर एक आदर्श गैस के एक निश्चित द्रव्यमान के लिए आयतन V बनाम ताप T आरेख दर्शाती है। आप आरेख से क्या अनुमान लगा सकते सकते है?
1.
2.
3.
4. अपर्याप्त जानकारी के कारण कोई अनुमान नहीं लगाया जा सकता है।


From the following P-T graph what interference can be drawn

1.
2.
3.
4. None of the above
निम्नलिखित P-T आरेख से क्या अनुमान लगाया जा सकता है?
1.
2.
3.
4. उपरोक्त में से कोई नहीं
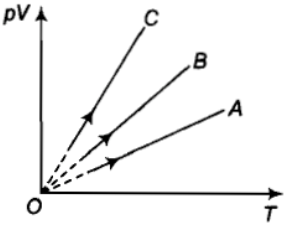
PV versus T graph of equal masses of is shown in the figure. Choose the correct alternative.

1. A corresponds to H2, B to He and C to O2
2. A corresponds to He, B to H2 and C to O2
3. A corresponds to He, B to O2 and C to H2
4. A corresponds to O2, B to He and C to H2
के समान द्रव्यमान के PV बनाम T ग्राफ को चित्र में दर्शाया गया है। सही विकल्प का चुनाव कीजिए।
1. H2 के संगत A, He के संगत B और O2 के संगत C है
2. He के संगत A, H2 के संगत B और O2 के संगत C है
3. He के संगत A, O2 के संगत B और H2 के संगत C है
4. O2 के संगत A, He के संगत B और H2 के संगत C है
Two different isotherms representing the relationship between pressure P and volume V at a given temperature of the same ideal gas are shown for masses and of the gas respectively in the figure given, then

1.
2.
3.
4. None of these
एक आदर्श गैस के क्रमशः और द्रव्यमान के लिए दिए गए ताप पर दाब P और आयतन V के बीच के संबंध को निरूपित करने वाले दो समतापी वक्र दर्शाए गए हैं, तब:
1.
2.
3.
4. इनमें से कोई नहीं


Two different masses m and 3m of an ideal gas are heated separately in a vessel of constant volume, the pressure P and absolute temperature T, graphs for these two cases are shown in the figure as A and B. The ratio of slopes of curves B to A is

1. 3 : 1
2. 1 : 3
3. 9 : 1
4. 1 : 9
एक आदर्श गैस के दो अलग-अलग द्रव्यमानों m और 3m को नियत आयतन, दाब P और परमताप T के एक पात्र में अलग-अलग गर्म किया जाता है, इन दो स्थितियों के लिए ग्राफ आकृति में A और B के रूप में दर्शाए जाते हैं। वक्र A से B की ढलान का अनुपात है:
1. 3 : 1
2. 1 : 3
3. 9 : 1
4. 1 : 9
© 2026 GoodEd Technologies Pvt. Ltd.